

The average user wants to look up products, purchase products, and search store info.
The average user wants to look up products, purchase products, and
search store info.
The average user wants to look up products, purchase products, and search store info.
We tested a total of 15 people aged between 30-60 years old with varying degrees of home renovation knowledge for our usability study. All of the participants had prior experience searching for and buying home renovation products, such as tiles or drywall, and had experience doing home renovations.
We tested a total of 15 people aged between 30-60 years old with varying degrees of home renovation knowledge for our usability study. All of the participants had prior experience searching for and buying home renovation products, such as tiles or drywall, and had experience doing home renovations.
Is this relevant?
Is this relevant?
Is this relevant?
First, we conducted a pilot study on pre and post questionnaires, and study tasks to ensure that the tasks we had planned for the participants were on track with realistic tasks a home renovator would have while using the website, and also allowing exploration within many product pages and using the search function to test usability and efficiency.
First, we conducted a pilot study on pre and post questionnaires, and study tasks to ensure that the tasks we had planned for the participants were on track with realistic tasks a home renovator would have while using the website, and also allowing exploration within many product pages and using the search function to test usability and efficiency.
Tasks
You are preparing to renovate your bathroom and need new floor tiles. Find a tile under the Purity series that is under $10/Pc. What is the name of the tile?
Find a Porcelain tile that is under the Shine Series and is white in color. What is the name of the tile?
Find a tile series (newly arrived category) that is suitable for both walls and floors. What is the name of the series?
You need to buy tiles for your new outdoor patio, find a type of tile that has a matte and semi-polish surface. What is the name and series of the tile?
Find the Paris series and determine what the price per piece is for the Paris Impression Gris. What is the price of the tile?
Find a white ceramic wall tile that has a size of 4”x 4”. What is the name of the tile?
Find a Twill pattern tile that is under $7 per square feet. What is the name of the tile?
Find a tile that is suited for building kitchen countertops. What is the name of this tile?
Look for a product called Rubika Blanco Mate. What series is this tile under?
Participants then worked on a series of five minute usability study tasks on their desktop computers and were asked to screen share via Zoom. They were encouraged to verbalize their thoughts with a think-aloud method so we could note down their comments and thoughts about different parts of the website. Afterwards, participants were given a post-test questionnaire through Google Forms asking about their overall experience.
Participants then worked on a series of five minute usability study tasks on their desktop computers and were asked to screen share via Zoom. They were encouraged to verbalize their thoughts with a think-aloud method so we could note down their comments and thoughts about different parts of the website. Afterwards, participants were given a post-test questionnaire through Google Forms asking about their overall experience.
Participants then worked on a series of five minute usability study tasks on their desktop computers and were asked to screen share via Zoom. They were encouraged to verbalize their thoughts with a think-aloud method so we could note down their comments and thoughts about different parts of the website. Afterwards, participants were given a post-test questio-nnaire through Google Forms asking about their overall experience.
Measuring Success
Measuring Success
Measuring Success
Quantitative data was measured by time (in seconds), number of clicks, and completion rate for each task (whether they were able to find what they were looking for within the time limit).
Quantitative data was measured by time (in seconds), number of clicks, and completion rate for each task (whether they were able to find what they were looking for within the time limit).
The most difficult task to complete was task nine (the average across participants was 195.3 seconds and 18 clicks), due to lack of filters, incorrect search results, and the process of searching through every series. Only 4/15 (27%) participants were able to complete all of the tasks. Most participants unable to complete task four (60% completion rate) and nine (53% completion rate). This data allowed us to see what tasks were difficult based on our parameters, and the qualitative data gave us insight into why they were having trouble with some tasks and not others.
The most difficult task to complete was task nine (the average across participants was 195.3 seconds and 18 clicks), due to lack of filters, incorrect search results, and the process of searching through every series. Only 4/15 (27%) participants were able to complete all of the tasks. Most participants unable to complete task four (60% completion rate) and nine (53% completion rate). This data allowed us to see what tasks were difficult based on our parameters, and the qualitative data gave us insight into why they were having trouble with some tasks and not others.
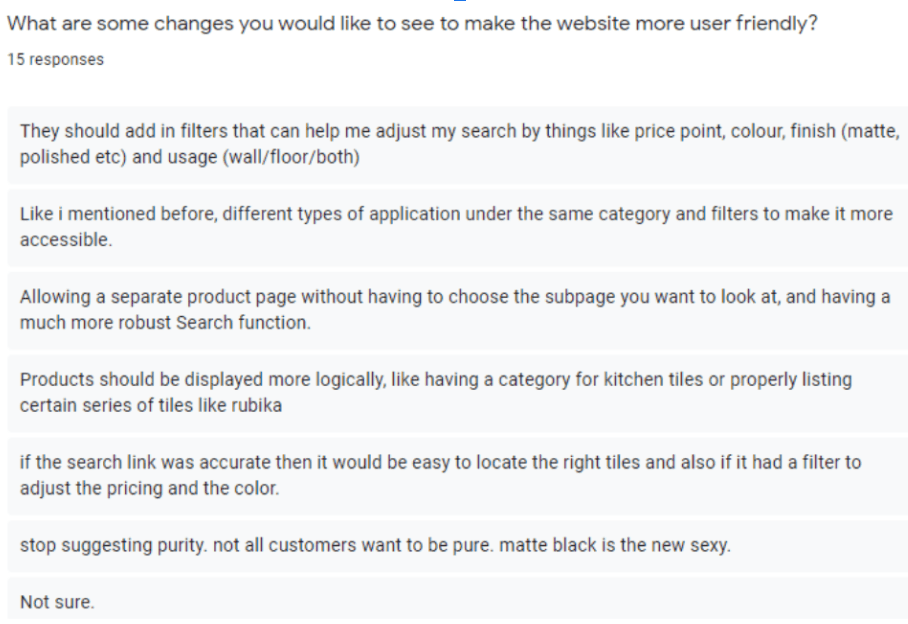
Qualitative data was taken from the website task questionnaire, pre-test questionnaire, post-test questionnaire, and our affinity diagram (from the think-aloud comments during the usability study).
Qualitative data was taken from the website task questionnaire, pre-test questionnaire, post-test questionnaire, and our affinity diagram (from the think-aloud comments during the usability study).
Qualitative data was taken from the website task questionnaire, pre-test questionnaire, post-test questionnaire, and our affinity diagram (from the think-aloud comments during the usability study).Overall, participants liked that the website was aesthetically pleasing, easy to learn, and had informative images. However, participants said they disliked the website because they wanted more options for the application tab, poor search results, wrong search suggestions, no organization of series (eg. alphabetical), no filters, and poor hierarchy (headings, subheadings, body text).
Qualitative data was taken from the website task questionnaire, pre-test questionnaire, post-test questionnaire, and our affinity diagram (from the think-aloud comments during the usability study).Overall, participants liked that the website was aesthetically pleasing, easy to learn, and had informative images. However, participants said they disliked the website because they wanted more options for the application tab, poor search results, wrong search suggestions, no organi-zation of series (eg. alphabetical), no filters, and poor hierarchy (headings, subheadings, body text).

Data gathered through the
questionnaires and the usability
study showed three main pain points:
Data gathered through the questionnaires
and the usability study showed three main
pain points:
Data gathered through the
questionnaires and the
usability study showed
three main pain points:
Based on the qualitative and quantitative data gathered from participants through the questionnaires and usability study, we found a number of pain points participants found within the website. The three main issues experienced by nearly all of the participants were:
Based on the qualitative and quantitative data gathered from participants through the questio-nnaires and usability study, we found a number of pain points participants found within the website. The three main issues experienced by nearly all of the participants were:
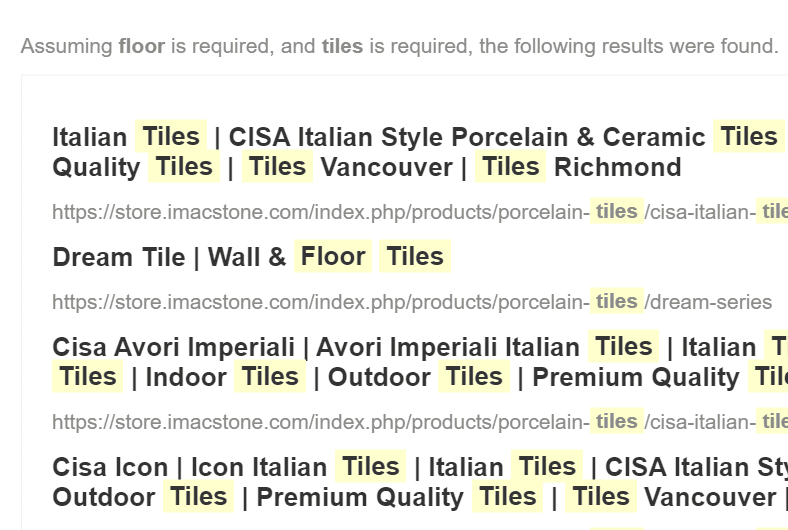
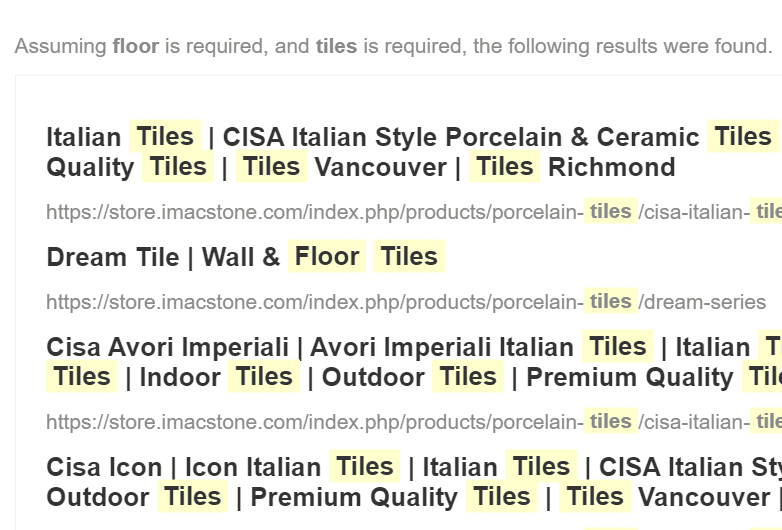
The search bar showed
inconsistent results
“Even when I typed 'Rubika Blanco Mate' into the search bar it didn’t show up so I just had to try going into all the different categories searching for a specific tile.” — Participant Quote
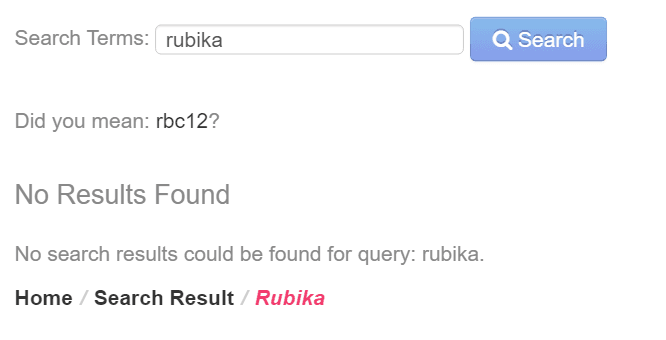
The search bar showed
inconsistent results
“Even when I typed 'Rubika Blanco Mate' into the search bar it didn’t show up so I just had to try going into all the different categories searching for a specific tile.” — Participant Quote
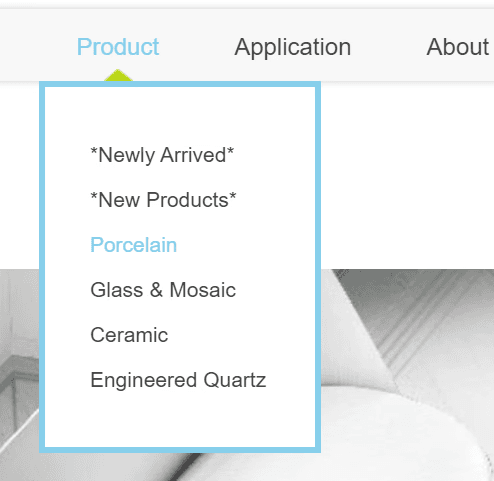
There was no way to
filter search results
“They should add in filters that can help me adjust my search by things like price point, colour, finish (matte, polish) and usage (wall/floor/both).” — Participant Quote
“They should add in filters that can help me adjust my search by things like price point, colour, finish (matte, polish) and usage (wall/floor/both).” — Participant Quote
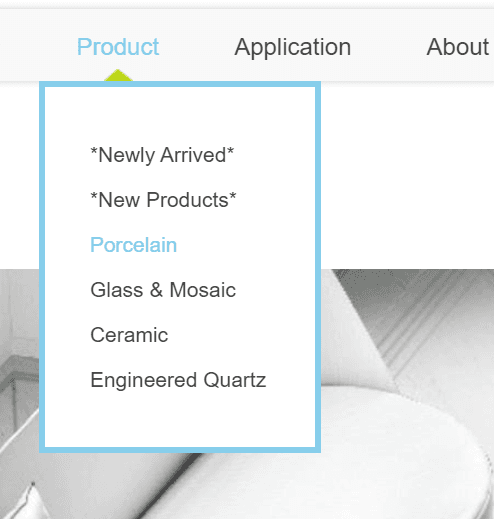
Product descriptions
lacked consistent
hierarchy and labelling
“The hierarchy of information could be better by having the text different sizes and fonts.” — Participant Quote
Product descriptions
lacked consistent
hierarchy and labelling
“The hierarchy of information could be better by having the text different sizes and fonts.” — Participant Quote
Product descriptions lacked consistent hierarchy and labelling
“The hierarchy of information could be better by having the text different sizes and fonts.” — Participant Quote
Solutions
Solutions


Design cannot make up for
poor user experience
Design cannot make up for
poor user experience
Design cannot make
up for poor user
experience
Seeing how users were familiar and unfamiliar with the website helped explain the main issues with the site’s functionality. iMac’s search engine used search terms familiar to only iMAC employees.
A website for product browsing, or e-commerce, must ensure that the design doesn’t take over the website’s functionality. While the website had some aesthetic appeal in certain sections, it did not meet their customer’s needs. The site’s function needs to be the main priority of websites that people use for information and especially shopping. In order to know the site is functional it is important to test out your design with your intended audience.
It’s easy for designers to think that re-designing or re-branding a website will somehow make it inherently better, but it is only through the process of experience (using a product or service) do we really consider the main purpose of what we are trying to fix; does it work.